|
|
Getting Older,
County by County
by Bo Beaulieu, Monica Rosas and Roberto Gallardo, Daily
Yonder
April 11, 2012

The median age of most every U.S. county is growing older. But rural
counties have the oldest median age — and the gap between rural and
urban counties is growing.
Southern Rural Development
Center
Rural counties have a higher median age than do small cities or urban
counties — and the gap between rural and urban is growing.
Not only is the world population growing, it's graying.
The United Nations reported last fall that the world’s population
reached 7 billion people. But at the same time, fertility rates
are dropping globally while the baby-boomer generation is growing older
each year.
According to some economists, this aging of the population poses real
economic threats. In fact, some argue that Europe’s current crisis is
not only financial but also demographic, since economic growth is
harder to achieve due to a decline in the number of young adults
entering the labor force.
A New York Times columnist argues that the world is experiencing a
“fertility implosion” and that “young people are [in the 21st century]
the scarce resource.”
How is the U.S. population -- especially America's rural counties --
faring in terms of age?
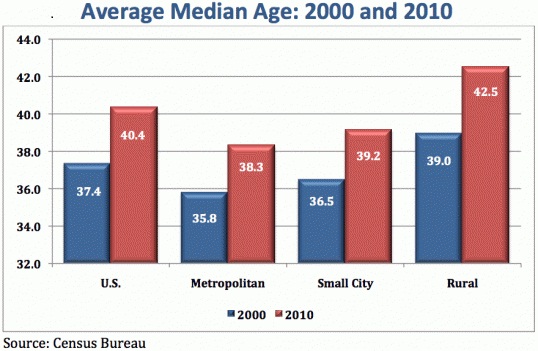
The graph above shows that the median age increased in all types of
counties between 2000 and 2010: metropolitan counties (those in
cities), rural counties and counties with small cities (between 10,000
and 50,000 people).
However, the biggest increase (3.6 years on average) occurred in rural
counties -- from an average median age of 39.0 years in
2000 to 42.5 years in 2010.
The average median age gap between metropolitan and rural counties
increased from 3.1 years in 2000 to 4.2 years in 2010. In other
words, rural counties are aging faster on average than their
metropolitan counterparts.
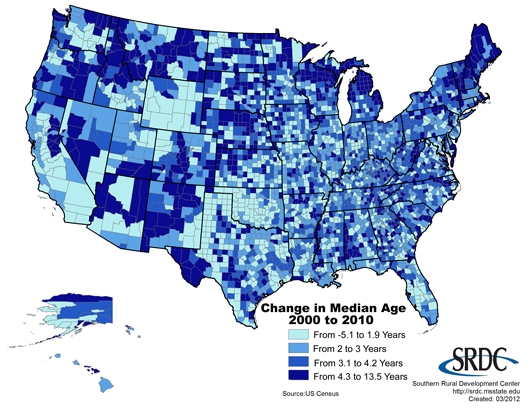
Is “graying” taking place at a similar pace or at varying rates across
the country? To help answer this question, all 3114 counties were
divided into four equal groups based on the change in median age
between 2000 and 2010.
In the map, the lighter the blue, the smaller the increase in median
age. (There were some counties that had a decline in median age.) Click
on the map to see a larger version.
 Southern Rural Development Center Southern Rural Development Center
The map shows the change in median age in all U.S. counties between
2000 and 2010. To see a bigger version, click on the map
Counties whose median age declined or increased by less than two years
between 2000 and 2010 are highlighted in the map as light blue.
California, Colorado, Florida, Oklahoma, and Texas had a significant
number of light blue counties.
Counties in dark blue experienced an increase in their median age in
the range of four years up to 13 years between 2000 and 2010. Dark blue
pockets are most visible in such states as Maine, New Hampshire,
Vermont, and Michigan.
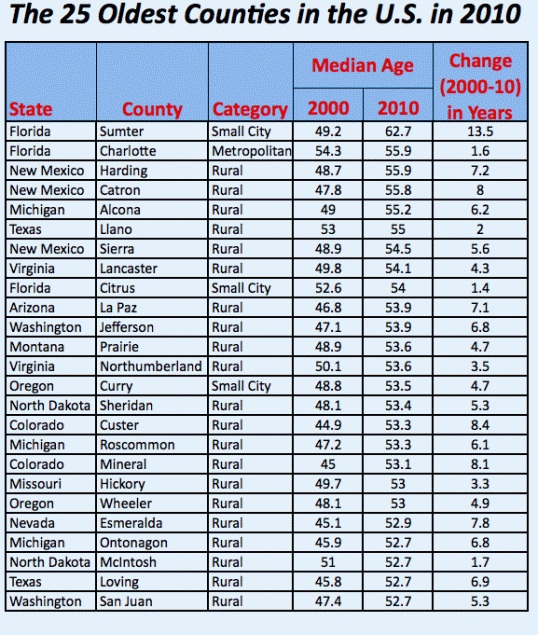
The table below shows the top 25 “oldest” counties in the nation in
descending order based on their 2010 median age. Sumter County in
Florida had a median age of 62.7 years in 2010 up from 49.2 in 2000.
One of the largest retirement communities in the nation is located in
Sumter County.
Note that the majority of “grayer” counties (24 of the 25 counties) are
rural or have small cities.
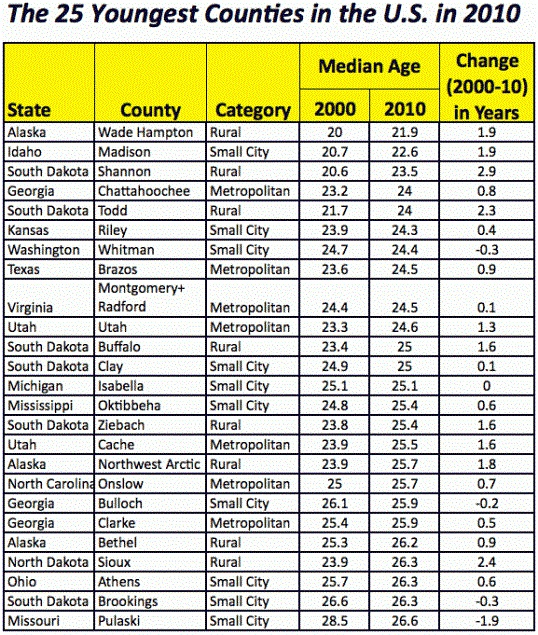
On the other hand, the table below showcases the top 25 “youngest”
counties in the nation in descending order based on their 2010 median
age. Wade Hampton in Alaska was the “youngest” county in the nation in
2010 with a median age of 21.9 (up from 20.0 in 2000).
Only 8 of the 25 counties are rural; 10 are small city counties; and
the rest are metropolitan counties.
More Information on US Health Issues
|
|